Optimized Engulfing StrategyOptimized Engulfing Strategy
The Optimized Engulfing Strategy is a trend-following system designed to capitalize on bullish and bearish engulfing patterns in the market. It uses a combination of price action, trend direction, and volatility-based risk management to execute high-probability trades.
Key Components:
Bullish Engulfing Pattern:
A bullish engulfing candle is identified when:
The current candle closes above its open (bullish).
The previous candle closes below its open (bearish).
The current candle's close is higher than the previous candle's open.
The current candle's open is lower than the previous candle's close.
This pattern signals potential bullish momentum.
Bearish Engulfing Pattern:
A bearish engulfing candle is identified when:
The current candle closes below its open (bearish).
The previous candle closes above its open (bullish).
The current candle's close is lower than the previous candle's open.
The current candle's open is higher than the previous candle's close.
This pattern signals potential bearish momentum.
Trend Confirmation:
Trades are only taken in the direction of the trend:
Buy: When the 50-period SMA (simple moving average) is above the 200-period SMA, indicating an uptrend.
Sell: When the 50-period SMA is below the 200-period SMA, indicating a downtrend.
Risk Management:
Stop Loss: Placed below the low of the engulfing candle (for buys) or above the high (for sells), with an additional buffer based on the ATR (Average True Range) multiplied by a user-defined factor (default: 1.5).
Take Profit: Calculated using a fixed risk-to-reward ratio (default: 1:2), ensuring a potential reward that is double the risk.
Session Filtering:
Trades can be limited to specific trading hours using a customizable session filter (default: 24 hours).
Trade Execution:
Separate logic is implemented for buy and sell trades, allowing independent toggling of long or short positions via user inputs.
Visualization:
Bullish and bearish engulfing candles are highlighted on the chart for clarity.
The ATR value is displayed in the top-right corner of the chart for reference.
How It Works:
Identify a bullish or bearish engulfing pattern.
Confirm the direction of the trend using the 50 SMA and 200 SMA.
Ensure the market is within the allowed session filter (e.g., London or New York sessions).
Enter a trade if all conditions are met:
Long trades for bullish engulfing patterns in an uptrend.
Short trades for bearish engulfing patterns in a downtrend.
Manage the trade using a stop loss and take profit based on ATR and the risk-reward ratio.
Search in scripts for "stop loss"

HOD/LOD/PMH/PML/PDH/PDL Strategy by @tradingbauhaus This script is a trading strategy @tradingbauhaus designed to trade based on key price levels, such as the High of Day (HOD), Low of Day (LOD), Premarket High (PMH), Premarket Low (PML), Previous Day High (PDH), and Previous Day Low (PDL). Below, I’ll explain in detail what the script does:
Core Functionality of the Script:
Calculates Key Price Levels:
HOD (High of Day): The highest price of the current day.
LOD (Low of Day): The lowest price of the current day.
PMH (Premarket High): The highest price during the premarket session (before the market opens).
PML (Premarket Low): The lowest price during the premarket session.
PDH (Previous Day High): The highest price of the previous day.
PDL (Previous Day Low): The lowest price of the previous day.
Draws Horizontal Lines on the Chart:
Plots horizontal lines on the chart for each key level (HOD, LOD, PMH, PML, PDH, PDL) with specific colors for easy visual identification.
Defines Entry and Exit Rules:
Long Entry (Buy): If the price crosses above the PMH (Premarket High) or the PDH (Previous Day High).
Short Entry (Sell): If the price crosses below the PML (Premarket Low) or the PDL (Previous Day Low).
Long Exit: If the price reaches the HOD (High of Day) during a long position.
Short Exit: If the price reaches the LOD (Low of Day) during a short position.
How the Script Works Step by Step:
Calculates Key Levels:
Uses the request.security function to fetch the HOD and LOD of the current day, as well as the highs and lows of the previous day (PDH and PDL).
Calculates the PMH and PML during the premarket session (before 9:30 AM).
Plots Levels on the Chart:
Uses the plot function to draw horizontal lines on the chart representing the key levels (HOD, LOD, PMH, PML, PDH, PDL).
Each level has a specific color for easy identification:
HOD: White.
LOD: Purple.
PDH: Orange.
PDL: Blue.
PMH: Green.
PML: Red.
Defines Trading Rules:
Uses conditions with ta.crossover and ta.crossunder to detect when the price crosses key levels.
Long Entry: If the price crosses above the PMH or PDH, a long position (buy) is opened.
Short Entry: If the price crosses below the PML or PDL, a short position (sell) is opened.
Long Exit: If the price reaches the HOD during a long position, the position is closed.
Short Exit: If the price reaches the LOD during a short position, the position is closed.
Executes Orders Automatically:
Uses the strategy.entry and strategy.close functions to open and close positions automatically based on the defined rules.
Advantages of This Strategy:
Based on Key Levels: Uses important price levels that often act as support and resistance.
Easy to Visualize: Horizontal lines on the chart make it easy to identify levels.
Automated: Entries and exits are executed automatically based on the defined rules.
Limitations of This Strategy:
Dependent on Volatility: Works best in markets with significant price movements.
False Crosses: There may be false crosses that generate incorrect signals.
No Advanced Risk Management: Does not include dynamic stop-loss or take-profit mechanisms.
How to Improve the Strategy:
Add Stop-Loss and Take-Profit: To limit losses and lock in profits.
Filter Signals with Indicators: Use RSI, MACD, or other indicators to confirm signals.
Optimize Levels: Adjust key levels based on the asset’s behavior.
In summary, this script is a trading strategy that operates based on key price levels, such as HOD, LOD, PMH, PML, PDH, and PDL. It is useful for traders who want to trade based on significant support and resistance levels.

DemaRSI StrategyThis is a repost to a old script that cant be updated anymore, the request was made on Feb, 27, 2016.
Here's a engaging description for the tradingview script:
**DemaRSI Strategy: A Proven Trading System**
Join thousands of traders who have already experienced the power of this highly effective strategy. The DemaRSI system combines two powerful indicators - DEMA (Double Exponential Moving Average) and RSI (Relative Strength Index) - to generate profitable trades with minimal risk.
**Key Features:**
* **Trend-Following**: Our algorithm identifies strong trends using a combination of DEMA and RSI, allowing you to ride the waves of market momentum.
* **Risk Management**: The system includes built-in stop-loss and take-profit levels, ensuring that your gains are protected and losses are minimized.
* **Session-Based Trading**: Trade during specific sessions only (e.g., London or New York) for even more targeted results.
* **Customizable Settings**: Adjust the length of moving averages, RSI periods, and other parameters to suit your trading style.
**What You'll Get:**
* A comprehensive strategy that can be used with any broker or platform
* Easy-to-use interface with customizable settings
* Real-time performance metrics and backtesting capabilities
**Start Trading Like a Pro Today!**
This script is designed for intermediate to advanced traders who want to take their trading game to the next level. With its robust risk management features, this strategy can help you achieve consistent profits in various market conditions.
**Disclaimer:** This script is not intended as investment advice and should be used at your own discretion. Trading carries inherent risks, and losses are possible.
~Llama3

DNSE VN301!, SMA & EMA Cross StrategyDiscover the tailored Pinescript to trade VN30F1M Future Contracts intraday, the strategy focuses on SMA & EMA crosses to identify potential entry/exit points. The script closes all positions by 14:25 to avoid holding any contracts overnight.
HNX:VN301!
www.tradingview.com
Setting & Backtest result:
1-minute chart, initial capital of VND 100 million, entering 4 contracts per time, backtest result from Jan-2024 to Nov-2024 yielded a return over 40%, executed over 1,000 trades (average of 4 trades/day), winning trades rate ~ 30% with a profit factor of 1.10.
The default setting of the script:
A decent optimization is reached when SMA and EMA periods are set to 60 and 15 respectively while the Long/Short stop-loss level is set to 20 ticks (2 points) from the entry price.
Entry & Exit conditions:
Long signals are generated when ema(15) crosses over sma(60) while Short signals happen when ema(15) crosses under sma(60). Long orders are closed when ema(15) crosses under sma(60) while Short orders are closed when ema(15) crosses over sma(60).
Exit conditions happen when (whichever came first):
Another Long/Short signal is generated
The Stop-loss level is reached
The Cut-off time is reached (14:25 every day)
*Disclaimers:
Futures Contracts Trading are subjected to a high degree of risk and price movements can fluctuate significantly. This script functions as a reference source and should be used after users have clearly understood how futures trading works, accessed their risk tolerance level, and are knowledgeable of the functioning logic behind the script.
Users are solely responsible for their investment decisions, and DNSE is not responsible for any potential losses from applying such a strategy to real-life trading activities. Past performance is not indicative/guarantee of future results, kindly reach out to us should you have specific questions about this script.
---------------------------------------------------------------------------------------
Khám phá Pinescript được thiết kế riêng để giao dịch Hợp đồng tương lai VN30F1M trong ngày, chiến lược tập trung vào các đường SMA & EMA cắt nhau để xác định các điểm vào/ra tiềm năng. Chiến lược sẽ đóng tất cả các vị thế trước 14:25 để tránh giữ bất kỳ hợp đồng nào qua đêm.
Thiết lập & Kết quả backtest:
Chart 1 phút, vốn ban đầu là 100 triệu đồng, vào 4 hợp đồng mỗi lần, kết quả backtest từ tháng 1/2024 tới tháng 11/2024 mang lại lợi nhuận trên 40%, thực hiện hơn 1.000 giao dịch (trung bình 4 giao dịch/ngày), tỷ lệ giao dịch thắng ~ 30% với hệ số lợi nhuận là 1,10.
Thiết lập mặc định của chiến lược:
Đạt được một mức tối ưu ổn khi SMA và EMA periods được đặt lần lượt là 60 và 15 trong khi mức cắt lỗ được đặt thành 20 tick (2 điểm) từ giá vào.
Điều kiện Mở và Đóng vị thế:
Tín hiệu Long được tạo ra khi ema(15) cắt trên sma(60) trong khi tín hiệu Short xảy ra khi ema(15) cắt dưới sma(60). Lệnh Long được đóng khi ema(15) cắt dưới sma(60) trong khi lệnh Short được đóng khi ema(15) cắt lên sma(60).
Điều kiện đóng vị thể xảy ra khi (tùy điều kiện nào đến trước):
Một tín hiệu Long/Short khác được tạo ra
Giá chạm mức cắt lỗ
Lệnh chưa đóng nhưng tới giờ cut-off (14:25 hàng ngày)
*Tuyên bố miễn trừ trách nhiệm:
Giao dịch hợp đồng tương lai có mức rủi ro cao và giá có thể dao động đáng kể. Chiến lược này hoạt động như một nguồn tham khảo và nên được sử dụng sau khi người dùng đã hiểu rõ cách thức giao dịch hợp đồng tương lai, đã đánh giá mức độ chấp nhận rủi ro của bản thân và hiểu rõ về logic vận hành của chiến lược này.
Người dùng hoàn toàn chịu trách nhiệm về các quyết định đầu tư của mình và DNSE không chịu trách nhiệm về bất kỳ khoản lỗ tiềm ẩn nào khi áp dụng chiến lược này vào các hoạt động giao dịch thực tế. Hiệu suất trong quá khứ không chỉ ra/cam kết kết quả trong tương lai, vui lòng liên hệ với chúng tôi nếu bạn có thắc mắc cụ thể về chiến lược giao dịch này.

XAUUSD Trend Strategy### Description of the XAUUSD Trading Strategy with Pine Script
This strategy is designed to trade gold (**XAUUSD**) using proven technical analysis principles. It combines key indicators such as **Exponential Moving Averages (EMA)**, the **Relative Strength Index (RSI)**, and **Bollinger Bands** to identify trading opportunities in trending market conditions.
---
#### Objective:
To maximize profits by identifying trend-aligned entry points while minimizing risks through well-defined Stop Loss and Take Profit levels.
---
### How It Works
1. **Indicators Used:**
- **Exponential Moving Averages (EMA):** Tracks short-term and long-term trends to confirm market direction.
- **Relative Strength Index (RSI):** Detects overbought or oversold conditions for potential reversals or trend continuation.
- **Bollinger Bands:** Measures volatility to identify breakout or reversion points.
2. **Entry Rules:**
- **Long (Buy):** Triggered when:
- The short-term EMA crosses above the long-term EMA (bullish trend confirmation).
- RSI exits oversold territory (<30), signaling buying momentum.
- The price breaks above the upper Bollinger Band, indicating a strong trend.
- **Short (Sell):** Triggered when:
- The short-term EMA crosses below the long-term EMA (bearish trend confirmation).
- RSI exits overbought territory (>70), signaling selling momentum.
- The price breaks below the lower Bollinger Band, indicating a strong downtrend.
3. **Risk Management:**
- **Stop Loss:** Automatically calculated based on a percentage of equity risk (customizable via inputs).
- **Take Profit:** Defined using a risk-to-reward ratio, ensuring consistent profitability when trades succeed.
4. **Visualization:**
- The chart displays the EMAs, Bollinger Bands, and entry/exit points for clear analysis.
---
### Key Features:
- **Customizable Parameters:** You can adjust EMAs, RSI thresholds, Bollinger Band settings, and risk levels to suit your trading style.
- **Alerts:** Automatic alerts for potential trade setups.
- **Backtesting-Ready:** Easily test historical performance on TradingView.
---
This strategy is ideal for gold traders looking for a systematic, rule-based approach to trading trends with minimal emotional interference.

Zero-Lag MA Trend FollowingScript Name: Zero-Lag MA Trend Following Auto-Trading
Purpose and Unique Features:
This script is designed to implement a trend-following auto-trading strategy by combining the Zero-Lag Moving Average (ZLMA), Exponential Moving Average (EMA), and ATR Bands. To differentiate it from similar scripts, the following key aspects are emphasized:
Zero-Lag MA (ZLMA):
Responds quickly to price changes, minimizing lag compared to EMA.
Detects crossovers with EMA and generates Diamond Signals to indicate trend reversals.
ATR Bands:
Measures market volatility to set stop-loss levels.
Helps optimize entry points and manage risk effectively.
Diamond Signals:
A vital visual cue indicating the early stages of trend reversals.
Green diamonds signal an uptrend, while red diamonds signal a downtrend.
Each component plays a distinct role, working synergistically to enhance trend detection and risk management. This system doesn’t merely combine indicators but optimizes them for comprehensive trend-following and risk control.
Usage Instructions:
Entry Conditions:
Long Entry:
Enter when a green Diamond Signal appears (ZLMA crosses above EMA).
Short Entry:
Enter when a red Diamond Signal appears (ZLMA crosses below EMA).
Exit Conditions:
Stop Loss:
Set at the lower boundary of the ATR band for BUY or the upper boundary for SELL at entry.
Take Profit:
Automatically executed based on a 1:2 risk-reward ratio.
Account Size: ¥100,0000
Commissions and Slippage: Assumed commission of 90 pips per trade and slippage of 1 pip.
Risk per Trade: 10% of account equity (adjustable based on risk tolerance).
Improvements and Original Features:
While based on open-source code, this script incorporates the following critical enhancements:
Diamond Signals from ZLMA and EMA Integration:
Improves entry accuracy with a proprietary trend detection strategy.
ATR Bands Utilization:
Adds a volatility-based risk management function.
Optimized Visual Entry Signals:
Includes plotted triangles (▲, ▼) to clearly indicate trend-following entry points.
Credits:
This script builds upon indicators developed by ChartPrime, whose innovative approach and insights have enabled a more advanced trend-following strategy. We extend our gratitude for their foundational work.
Additionally, it integrates technical methods based on Zero-Lag Moving Average (ZLMA), EMA, and ATR Bands, leveraging insights from the trading community.
Chart Display Options:
The script offers options to toggle the visual signals (Diamond Signals, trend lines, and entry points) on or off, keeping the chart clean while maximizing analytical efficiency.
Disclaimer:
This script is provided for educational purposes and past performance does not guarantee future results.
Use it responsibly with proper risk management.

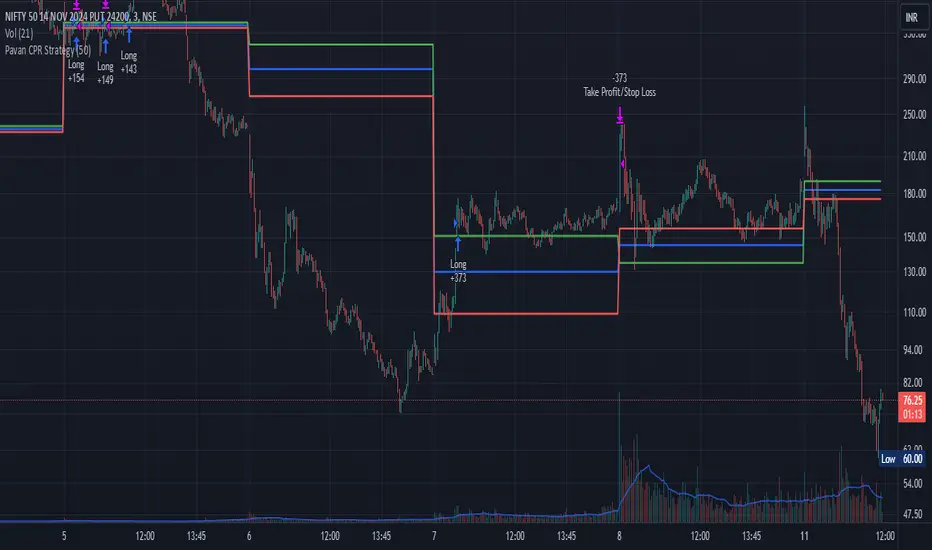
Pavan CPR Strategy Pavan CPR Strategy (Pine Script)
The Pavan CPR Strategy is a trading system based on the Central Pivot Range (CPR), designed to identify price breakouts and generate long trade signals. This strategy uses key CPR levels (Pivot, Top CPR, and Bottom CPR) calculated from the daily high, low, and close to inform trade decisions. Here's an overview of how the strategy works:
Key Components:
CPR Calculation:
The strategy calculates three critical CPR levels for each trading day:
Pivot (P): The central value, calculated as the average of the high, low, and close prices.
Top Central Pivot (TC): The midpoint of the daily high and low, acting as the resistance level.
Bottom Central Pivot (BC): Derived from the pivot and the top CPR, providing a support level.
The script uses request.security to fetch these CPR values from the daily timeframe, even when applied on intraday charts.
Trade Entry Condition:
A long position is initiated when:
The current price crosses above the Top CPR level (TC).
The previous close was below the Top CPR level, signaling a breakout above a key resistance level.
This condition aims to capture upward momentum as the price breaks above a significant level.
Exit Strategy:
Take Profit: The position is closed with a profit target set 50 points above the entry price.
Stop Loss: A stop loss is placed at the Pivot level to protect against unfavorable price movements.
Visual Reference:
The script plots the three CPR levels on the chart:
Pivot: Blue line.
Top CPR (TC): Green line.
Bottom CPR (BC): Red line.
These plotted levels provide visual guidance for identifying potential support and resistance zones.
Use Case:
The Pavan CPR Strategy is ideal for intraday traders who want to capitalize on price movements and breakouts above critical CPR levels. It provides clear entry and exit signals based on price action and is best used in conjunction with proper risk management.
Note: The strategy is written in Pine Script v5 for use on TradingView, and it is recommended to backtest and optimize it for the asset or market you are trading.
Smart Money Concept Strategy - Uncle SamThis strategy combines concepts from two popular TradingView scripts:
Smart Money Concepts (SMC) : The strategy identifies key levels in the market (swing highs and lows) and draws trend lines to visualize potential breakouts. It uses volume analysis to gauge the strength of these breakouts.
Smart Money Breakouts : This part of the strategy incorporates the idea of "Smart Money" – institutional traders who often lead market movements. It looks for breakouts of established levels with significant volume, aiming to catch the beginning of new trends.
How the Strategy Works:
Identification of Key Levels: The script identifies swing highs and swing lows based on a user-defined lookback period. These levels are considered significant points where price has reversed in the past.
Drawing Trend Lines: Trend lines are drawn connecting these key levels, creating a visual representation of potential support and resistance zones.
Volume Analysis: The script analyzes the volume during the formation of these levels and during breakouts. Higher volume suggests stronger moves and increases the probability of a successful breakout.
Entry Conditions:
Long Entry: A long entry is triggered when the price breaks above a resistance line with significant volume, and the moving average trend filter (optional) is bullish.
Short Entry: A short entry is triggered when the price breaks below a support line with significant volume, and the moving average trend filter (optional) is bearish.
Exit Conditions:
Stop Loss: Customizable stop loss percentages are implemented to protect against adverse price movements.
Take Profit: Customizable take profit percentages are used to lock in profits.
Credits and Compliance:
This strategy is inspired by the concepts and code from "Smart Money Concepts (SMC) " and "Smart Money Breakouts ." I've adapted and combined elements of both scripts to create this strategy. Full credit is given to the original authors for their valuable contributions to the TradingView community.
To comply with TradingView's House Rules, I've made the following adjustments:
Clearly Stated Inspiration: The description explicitly mentions the original scripts and authors as the inspiration for this strategy.
No Direct Copying: The code has been modified and combined, not directly copied from the original scripts.
Educational Purpose: The primary purpose of this strategy is for learning and backtesting. It's not intended as financial advice.
Important Note:
This strategy is intended for educational and backtesting purposes only. It should not be used for live trading without thorough testing and understanding of the underlying concepts. Past performance is not indicative of future results.

AI SuperTrend x Pivot Percentile - Strategy [PresentTrading]█ Introduction and How it is Different
The AI SuperTrend x Pivot Percentile strategy is a sophisticated trading approach that integrates AI-driven analysis with traditional technical indicators. Combining the AI SuperTrend with the Pivot Percentile strategy highlights several key advantages:
1. Enhanced Accuracy in Trend Prediction: The AI SuperTrend utilizes K-Nearest Neighbors (KNN) algorithm for trend prediction, improving accuracy by considering historical data patterns. This is complemented by the Pivot Percentile analysis which provides additional context on trend strength.
2. Comprehensive Market Analysis: The integration offers a multi-faceted approach to market analysis, combining AI insights with traditional technical indicators. This dual approach captures a broader range of market dynamics.
BTC 6H L/S Performance
Local
█ Strategy: How it Works - Detailed Explanation
🔶 AI-Enhanced SuperTrend Indicators
1. SuperTrend Calculation:
- The SuperTrend indicator is calculated using a moving average and the Average True Range (ATR). The basic formula is:
- Upper Band = Moving Average + (Multiplier × ATR)
- Lower Band = Moving Average - (Multiplier × ATR)
- The moving average type (SMA, EMA, WMA, RMA, VWMA) and the length of the moving average and ATR are adjustable parameters.
- The direction of the trend is determined based on the position of the closing price in relation to these bands.
2. AI Integration with K-Nearest Neighbors (KNN):
- The KNN algorithm is applied to predict trend direction. It uses historical price data and SuperTrend values to classify the current trend as bullish or bearish.
- The algorithm calculates the 'distance' between the current data point and historical points. The 'k' nearest data points (neighbors) are identified based on this distance.
- A weighted average of these neighbors' trends (bullish or bearish) is calculated to predict the current trend.
For more please check: Multi-TF AI SuperTrend with ADX - Strategy
🔶 Pivot Percentile Analysis
1. Percentile Calculation:
- This involves calculating the percentile ranks for high and low prices over a set of predefined lengths.
- The percentile function is typically defined as:
- Percentile = Value at (P/100) × (N + 1)th position
- Where P is the desired percentile, and N is the number of data points.
2. Trend Strength Evaluation:
- The calculated percentiles for highs and lows are used to determine the strength of bullish and bearish trends.
- For instance, a high percentile rank in the high prices may indicate a strong bullish trend, and vice versa for bearish trends.
For more please check: Pivot Percentile Trend - Strategy
🔶 Strategy Integration
1. Combining SuperTrend and Pivot Percentile:
- The strategy synthesizes the insights from both AI-enhanced SuperTrend and Pivot Percentile analysis.
- It compares the trend direction indicated by the SuperTrend with the strength of the trend as suggested by the Pivot Percentile analysis.
2. Signal Generation:
- A trading signal is generated when both the AI-enhanced SuperTrend and the Pivot Percentile analysis agree on the trend direction.
- For instance, a bullish signal is generated when both the SuperTrend is bullish, and the Pivot Percentile analysis shows strength in bullish trends.
🔶 Risk Management and Filters
- ADX and DMI Filter: The strategy uses the Average Directional Index (ADX) and the Directional Movement Index (DMI) as filters to assess the trend's strength and direction.
- Dynamic Trailing Stop Loss: Based on the SuperTrend indicator, the strategy dynamically adjusts stop-loss levels to manage risk effectively.
This strategy stands out for its ability to combine real-time AI analysis with established technical indicators, offering traders a nuanced and responsive tool for navigating complex market conditions. The equations and algorithms involved are pivotal in accurately identifying market trends and potential trade opportunities.
█ Usage
To effectively use this strategy, traders should:
1. Understand the AI and Pivot Percentile Indicators: A clear grasp of how these indicators work will enable traders to make informed decisions.
2. Interpret the Signals Accurately: The strategy provides bullish, bearish, and neutral signals. Traders should align these signals with their market analysis and trading goals.
3. Monitor Market Conditions: Given that this strategy is sensitive to market dynamics, continuous monitoring is crucial for timely decision-making.
4. Adjust Settings as Needed: Traders should feel free to tweak the input parameters to suit their trading preferences and to respond to changing market conditions.
█Default Settings and Their Impact on Performance
1. Trading Direction (Default: "Both")
Effect: Determines whether the strategy will take long positions, short positions, or both. Adjusting this setting can align the strategy with the trader's market outlook or risk preference.
2. AI Settings (Neighbors: 3, Data Points: 24)
Neighbors: The number of nearest neighbors in the KNN algorithm. A higher number might smooth out noise but could miss subtle, recent changes. A lower number makes the model more sensitive to recent data but may increase noise.
Data Points: Defines the amount of historical data considered. More data points provide a broader context but may dilute recent trends' impact.
3. SuperTrend Settings (Length: 10, Factor: 3.0, MA Source: "WMA")
Length: Affects the sensitivity of the SuperTrend indicator. A longer length results in a smoother, less sensitive indicator, ideal for long-term trends.
Factor: Determines the bandwidth of the SuperTrend. A higher factor creates wider bands, capturing larger price movements but potentially missing short-term signals.
MA Source: The type of moving average used (e.g., WMA - Weighted Moving Average). Different MA types can affect the trend indicator's responsiveness and smoothness.
4. AI Trend Prediction Settings (Price Trend: 10, Prediction Trend: 80)
Price Trend and Prediction Trend Lengths: These settings define the lengths of weighted moving averages for price and SuperTrend, impacting the responsiveness and smoothness of the AI's trend predictions.
5. Pivot Percentile Settings (Length: 10)
Length: Influences the calculation of pivot percentiles. A shorter length makes the percentile more responsive to recent price changes, while a longer length offers a broader view of price trends.
6. ADX and DMI Settings (ADX Length: 14, Time Frame: 'D')
ADX Length: Defines the period for the Average Directional Index calculation. A longer period results in a smoother ADX line.
Time Frame: Sets the time frame for the ADX and DMI calculations, affecting the sensitivity to market changes.
7. Commission, Slippage, and Initial Capital
These settings relate to transaction costs and initial investment, directly impacting net profitability and strategy feasibility.

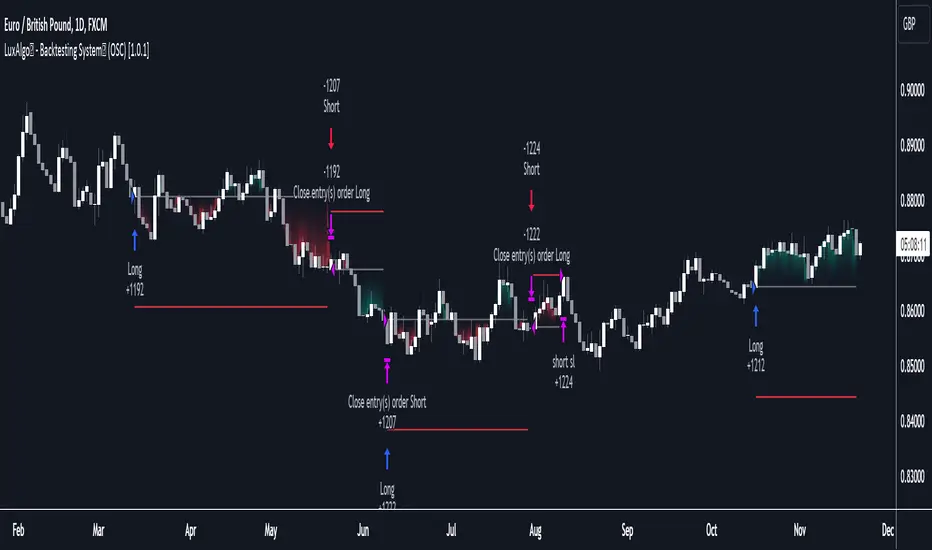
LuxAlgo - Backtester (OSC)The OSC Backtester is an innovative strategy script that allows users to create a wide variety of strategies using various unique oscillators.
By utilizing our 'Step' and 'Match' algorithms, users can create custom and complex strategy entries from each of the supported oscillators and included conditions, as well as any external sources, allowing users to create entries from a sequence of conditions and/or multiple matching conditions.
We included a complete alert system that will send a notification for each action taken by the strategy and we also allow users to set custom messages for each action taken by a strategy.
🔶 Features
🔹 Step & Match Algorithm
More complex entry rules can be created by using multiple conditions together, this is done thanks to the Step dropdown setting on the right of each condition.
The Step setting is directly related to the Step & Match algorithm and works in two ways:
When two or more conditions have the same step number, both conditions are evaluated. Used to test matching conditions.
When two or more conditions have different step numbers, each conditions will be evaluated in order, testing for the first step and switching to the next step once the previous one is true. When the final step is true the strategy will open a market order. Used to create sequence of conditions.
This operation is complementary, as you can create a sequence of conditions with one step consisting of two or more matching conditions as long as they have the same step number.
🔹 Fully Customizable Entries From Various Oscillators And Conditions
We allow the users to set entries using our unique HyperWave, Smart Money Flow, and their derived conditions as entries.
The Hyper Wave is a normalized adaptive oscillator aiming to reflect price trends without returning a high amount of noise.
The Smart Money Flow aims to detect trends based on market activity, by doing a comparative analysis between current volume and historical volume. A Smart Money Flow above 50 suggest market participants are bullish, else bearish. Derived from this oscillator we have Overflow indications, this indicator detects when market is overbought or oversold based on participants activity.
Other entries include proprietary reversal signals, real-time divergence detection, oscillator confluence (indicating how aligned each oscillator is), as well as entries using external sources.
🔹 Complete Alert System
Users can get alerted for any action executed by a strategy, from opening positions to closing them.
The message field in the Alert Messages setting section allows for the strategy to send a custom alert message depending on the action taken by the strategy, if no messages are set the strategy will send default messages.
🔶 Usage
Users can create a wide variety of strategies from this script, whether they are trend-following or contrarian traders.
Let's see a contrarian (revesal-based) strategy example using the following entry conditions:
Long: Hyperwave bullish divergence and oversold Hyperwave (lower than 20).
Short: Hyperwave bearish divergence and overbought Hyperwave (greater than 20).
We can also introduce take-profit and stop-loss exit conditions based on external indicators, allowing more control over exits in our strategy. For example:
Long: Hyperwave crossing over 50 while money flow is bearish.
Short: Hyperwave crossing under 50 while money flow is bullish.
Exit Long on a profit (long exit tp): Hyperwave crossing 80.
Exit Short on a profit (short exit tp): Hyperwave crossing 20.
While this strategy script can be used as a standalone, we recommend using other indicators creatively to assist with entries and exits as well as TP/SLs.
Our Step & Match algorithm can magnify interoperability, allowing for way more complete strategies through complex conditions, let's demonstrate this using the following entries:
Long: Any bullish reversal occurring after the price crosses over the lowest upper reversal zone of the Signals & Overlays™.
Short: Any bearish reversal occurring after the price crosses under the highest lower reversal zone of the Signals & Overlays™.
Long TP/SL: 5 ATR's away from the entry price.
Short TP/SL: 5 ATR's away from the entry price.
🔶 Strategy Properties (Important)
This script backtest is done on daily EURGBP, using the following backtesting properties:
Balance (default): 10 000 (default base currency)
Order Size: 10% of the equity
Comission: 3.4 pips (average spread for EURGBP)
Slippage: 3 tick
Stop Loss: 0.02 points away from entry price
We use these properties to ensure a realistic preview of the backtesting system, do note that default properties can be different for various reasons described below:
Order Size: 1 contract by default, this is to allow the strategy to run properly on most instruments such as futures.
Comission: Comission can vary depending on the market and instrument, there is no default value that might return realistic results.
We strongly recommend all users to ensure they adjust the Properties within the script settings to be in line with their accounts & trading platforms of choice to ensure results from the strategies built are realistic.
🔶 How To Access
You can see the Author's Instructions below to learn how to get access.
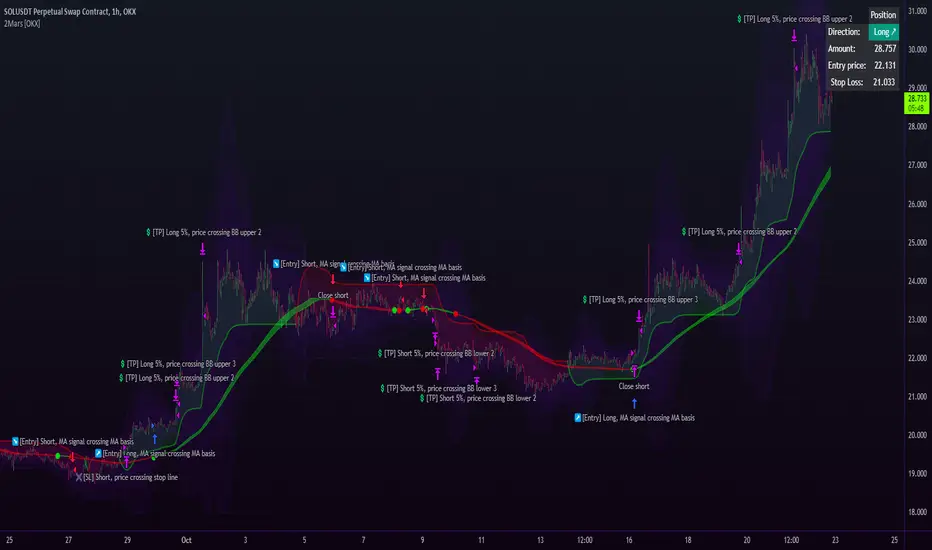
2Mars strategy [OKX]The strategy is based on the intersection of two moving averages, which requires adjusting the parameters (ratio and multiplier) for the moving average.
Basis MA length: multiplier * ratio
Signal MA length: multiplier
The SuperTrend indicator is used for additional confirmation of entry into a position.
Bollinger Bands and position reversal are used for take-profit.
About stop loss:
If activated, the stop loss price will be updated on every entry.
Basic setup:
Additional:
Alerts for OKX:
SuperTrend Enhanced Pivot Reversal - Strategy [PresentTrading]
- Introduction and How it is Different
The SuperTrend Enhanced Pivot Reversal is a unique approach to trading that combines the best of two worlds: the precision of pivot reversal points and the trend-following power of the SuperTrend indicator. This strategy is designed to provide traders with clear entry and exit points, while also filtering out potentially false signals using the SuperTrend indicator.
BTCUSDT 6hr
ETHBTC 6hr
Unlike traditional pivot reversal strategies, this approach uses the SuperTrend indicator as a filter. This means that it only takes trades that align with the overall trend, as determined by the SuperTrend indicator. This can help to reduce the number of false signals and improve the overall profitability of the strategy.
The Pivot Reversal Strategy with SuperTrend Filter is particularly well-suited to the cryptocurrency market for the reason of High Volatility. This means that prices can change rapidly in a very short time, making it possible to make a profit quickly. The strategy's use of pivot points allows traders to take advantage of these rapid price changes by identifying potential reversal points
- Strategy: How it Works
The strategy works by identifying pivot reversal points, which are points in the price chart where the price is likely to reverse. These points are identified using a combination of the ta.pivothigh and ta.pivotlow functions, which find the highest and lowest points in the price chart over a certain period.
Once a pivot reversal point is identified, the strategy checks the direction of the SuperTrend indicator. If the SuperTrend is positive (indicating an uptrend), the strategy will only take long trades. If the SuperTrend is negative (indicating a downtrend), the strategy will only take short trades.
The strategy also includes a stop loss level, which is set as a percentage of the entry price. This helps to limit potential losses if the price moves in the opposite direction to the trade.
- Trade Direction
The trade direction can be set to "Long", "Short", or "Both". This allows the trader to choose whether they want to take only long trades (buying low and selling high), only short trades (selling high and buying low), or both. This can be useful depending on the trader's view of the market and their risk tolerance.
- Usage
To use the Pivot Reversal Strategy with SuperTrend Filter, simply input the desired parameters into the script and apply it to the price chart of the asset you wish to trade. The strategy will then identify potential trade entry and exit points, which will be displayed on the price chart.
- Default Settings
The default settings for the strategy are as follows:
ATR Length: 5
Factor: 2.618
Trade Direction: Both
Stop Loss Level: 20%
Commission: 0.1%
Slippage: 1
Currency: USD
Each trade: 10% of account equity
Initial capital: $10,000
These settings can be adjusted to suit the trader's preferences and risk tolerance. Always remember to test any changes to the settings using historical data before applying them to live trades.

Bitcoin 30m Swing Trader Long/Short StrategyIntro
I want to share the results of my passionate hobby and the unstoppable chase for a profitable automated trading strategy. It has been created with the intention of trading only Bitcoin. Altcoins are not interesting for me, as I have discovered lots of issues with finding the right parameter values for experiencing a good performance. As altcoins typically follow the trend of bitcoin and characteristically have a high volatility that may cause stop-hunts, I decided to not over complicate this project. I was just aiming for a profitable trading strategy with an acceptable drawdown and enough confidence by a statistically significant number of trades beside a wide backtesting timespan (credits going out to TradingView: Deep Backtesting).
Total time spent on this is approximately 2 years.
Indicators used
RSI: Used for entries and trend reversal spots
MACD: Used for entry and exit optimiziation
ATR: Used for dynamic offsets in trend definition indicator
Custom trend indicator: Self-made indicator, based on simple price action of higher timeframes using pivot points to find support and resistance zones that have formerly been created
Strategy parameters
I have reduced the total parameters used to just a few. It took lots of working hours to find appropriate values along the trading algorithm and I don’t want to overcomplicate it to you.
This strategy is for those, who have been looking for a working strategy. No DIY kit.
Feel free to adapt Take profit or stop loss targets. But it’s not recommended to do so.
How it works
Entries:
I started with a kind of template that I have been using for strategies for a long time. This includes how to find the right Entries during a trend as well as spotting trend reverse opportunities. Here I combine simple indicators like RSI and MACD beside necessary trend conditions. If a target RSI Value is hit, it will enter a trade, after MACD histogram has stopped to fall/rise. Depends on long/short. While we are in a trade and trend reversed, it waits for a specific RSI target level to be hit, to reverse the trade. As simple as it is, it closes the open one and starts a trade in other direction.
Micro trend:
It starts to get more interesting when it comes to trend recognition, as it forms the core of the strategy and discovering appropriate values for it has been very hard. The final trend variable is defined by the responses over higher timeframes of my self-made trend indicator. Executed on the current timeframe, the trend indicator is quite interesting. But for a automated trading strategy it is necessary to deviate trading instructions from higher timeframes trends.
Macro trend:
The same process that happens for micro trend is also applied with much higher timeframes, like 3D or weekly. The basic assumption is, that if we are in a bull or bear run, where retail investors are flooding the markets, we are increasing our take profit targets respectively. This way we can catch bigger moves in bigger trends.
Exits:
Closing a trade generally happens when a TP target (in %) is hit, or the SL (in %) is hit. The strategy has a special treatment with SL’s. After it happens, the strategy is more careful about market conditions and typically waits for a countertrade. The third way of closing a trade has already been mentioned: the reverse trades. They happen during choppy market conditions. The strategy has also special awareness here and tracks, if reverse trades start to happen more often. After a while, it starts to be more restrictive in opening new reverse trades.
Performance
Capabilities and limitations:
As I have already mentioned the strategy is only optimized for bitcoin (Perpetual Futures). This does not mean, it can not be used on other markets, because the algorithm itself is universal appliable. A very hard task was about finding the right parameter values for the strategy performing like this. If you have a special wish to configure this strategy for a specific market, DM me. The strategy has been tested with different configurations on the following timeframes: 30, 15, 10, 5, 1. I have decided to publish the one for 30m TF, because its performance simply convinced me.
Repainting:
It has been tested lots of times against repainting.
Confidence:
The total backtesting performance reaches out to 2019-09-08. So the strategy has been managing to be successful since then, but this does not guarantee that the logic, this strategy follows, is going to continue this level in future.
Commission:
The algorithm is configured with 0.04% commission per trade, as it is on Binance (for Future Market orders).
Ordersize:
Its totally up to you, how much of your total equity should be traded. Nevertheless, I would personally recommend to not exceed 50% ordersize of your equity with this strategy. In the past, you would have had great performance beside a drawdown, that was from psychological point of view good to handle with. This strategy additionally uses STOP LOSSES, so you can never loose you whole ordersize at one trade.
Slippage:
You also must consider about getting slipped when trading this strategy on live markets. Statistically one could assume, that the slippage could be neutral, as it can be both positive or negative. It depends on your execution time, the exchange, on which you are executing trades and market conditions. But keep it in mind, as if you have too much slippage, this strategy would be unprofitable.

RSI Divergence Strategywhat is "RSI Divergence Strategy"?
it is a RSI strategy based this indicator:
what it does?
it gives buy or sell signals according to RSI Divergences. it also has different variables such as "take profit", "stop loss" and trailing stop loss.
how it does it?
it uses the "RSI Divergence" indicator to give signal. For detailed information on how it works, you can visit the link above. The quantity of the inputs is proportional to the rsi values. Long trades are directly traded with "RSI" value, while short poses are traded with "100-RSI" value.
How to use it?
The default settings are for scalp strategy but can be used for any type of trading strategy. you can develop different strategies by changing the sections. It is quite simple to use.
RSI length is length of RSİ
source is source of RSİ
RSİ Divergence lenght is length of line on the RSI
The "take profit", "stop" and "trailing stop" parts used in the "buy" group only affect buys. The "sell" group is similarly independent of the variables in the "buy" group.
The "zoom" section is used to enlarge or reduce the indicator. it only changes the appearance, it does not affect the results of the strategy.

Inverse MACD + DMI Scalping with Volatility Stop (By Coinrule)This script is focused on shorting during downtrends and utilises two strength based indicators to provide confluence that the start of a short-term downtrend has occurred - catching the opportunity as soon as possible.
This script can work well on coins you are planning to hodl for long-term and works especially well whilst using an automated bot that can execute your trades for you. It allows you to hedge your investment by allocating a % of your coins to trade with, whilst not risking your entire holding. This mitigates unrealised losses from hodling as it provides additional cash from the profits made. You can then choose to hodl this cash, or use it to reinvest when the market reaches attractive buying levels.
Alternatively, you can use this when trading contracts on futures markets where there is no need to already own the underlying asset prior to shorting it.
ENTRY
The trading system uses the Momentum Average Convergence Divergence (MACD) indicator and the Directional Movement Index (DMI) indicator to confirm when the best time is for selling. Combining these two indicators prevents trading during uptrends and reduces the likelihood of getting stuck in a market with low volatility.
The MACD is a trend following momentum indicator and provides identification of short-term trend direction. In this variation it utilises the 12-period as the fast and 26-period as the slow length EMAs, with signal smoothing set at 9.
The DMI indicates what way price is trending and compares prior lows and highs with two lines drawn between each - the positive directional movement line (+DI) and the negative directional movement line (-DI). The trend can be interpreted by comparing the two lines and what line is greater. When the negative DMI is greater than the positive DMI, there are more chances that the asset is trading in a sustained downtrend, and vice versa.
The system will enter trades when two conditions are met:
1) The MACD histogram turns bearish.
2) When the negative DMI is greater than the positive DMI.
EXIT
The strategy comes with a fixed take profit combined with a volatility stop, which acts as a trailing stop to adapt to the trend's strength. Depending on your long-term confidence in the asset, you can edit the fixed take profit to be more conservative or aggressive.
The position is closed when:
Take-Profit Exit: +8% price decrease from entry price.
OR
Stop-Loss Exit: Price crosses above the volatility stop.
In general, this approach suits medium to long term strategies. The backtesting for this strategy begins on 1 April 2022 to 18 July 2022 in order to demonstrate its results in a bear market. Back testing it further from the beginning of 2022 onwards further also produces good returns.
Pairs that produce very strong results include SOLUSDT on the 45m timeframe, MATICUSDT on the 2h timeframe, and AVAUSDT on the 1h timeframe. Generally, the back testing suggests that it works best on the 45m/1h timeframe across most pairs.
A trading fee of 0.1% is also taken into account and is aligned to the base fee applied on Binance.

The best scalping strategyPullbacks are always the most difficult part of trading, and when this happens, we struggle to make a decision about whether to continue trading and wait for a recovery or reduce losses. Similarly, when the instrument has a good trend, it is often difficult to make a decision if we want to withdraw some profit. This strategy is aimed at facilitating these decisions, it looks for price impulses and, based on this, calculates the pullback of the price at which it is necessary to place limit buy orders (yellow lines) based on Fibonacci levels. We place the stop loss on the red line, on the blue and pink lines it is necessary to put a take profit of 50% each. The entry and exit indicator does not always correctly display the entry and exit points, so it is necessary to work with limit orders.
-In the settings, you can change the number of candles participating in the cycle, if the price is at the same level for a long time and limit orders do not work, then it is recommended to reduce the number of candles.
-The remaining parameters are still under development, it is better not to touch them. In the future, I plan to add a limit on the amount of loss as a percentage, for more fine-tuning of risk management
Откаты всегда являются самой сложной частью торговли, и когда это происходит, мы изо всех сил пытаемся принять решение о том, продолжать ли торговлю и ждать восстановления или сократить убытки. Точно так же, когда инструмент имеет хороший тренд, часто трудно принять решение, если мы хотим снять некоторую прибыль. Эта стратегия направлена на то, чтобы облегчить эти решения, она ищет ценовые импульсы и исходя из этого рассчитывает по уровням фибоначи откат цены, на которых необходимо разместить лимитные ордера на покупку (желтые линии). Стоп-лос размещаем на красной линии, на синей и розовой линии необходимо поставить тэйк-профит по 50%. Индикатор входа и выхода не всегда корректно отображает точку входа и выхода, поэтому необходимо работать с лимитными ордерами.
-В настройках можно менять количество свечей участвующих в цикле, если цена долго находится на одном уровне и не срабатывают лимитные ордера то рекомендуются уменьшить количество свечей.
-Остальные параметры до сих пор находятся в разработке, их лучше не трогать. В дальнейшем планирую добавить ограничение размера убытка в процентах, для более тонкой настройки риск менеджмента

AT_MR-15m-ALGO Strategy IndicatorsThis strategy includes systems based on the return-to-mean method.
It creates BUY-SELL signals by getting approval from volatility, trend, momentum, volume, incompatibility and artificial intelligence formations in the system.
Unaffected by Pump and Dump (extreme spikes and dips). In some cases, it can turn this into an opportunity.
Our loss rates in transactions are minimized by algorithms. In other words, it has minimized the loss rates in the position with the stop loss systems and artificial intelligence in it.
IMPORTANT NOTE:
1-) In order for our indicator to be used efficiently, it is necessary to optimize its parameters on a monthly basis. It is offered to you by optimizing regularly by our technical team every month so that it can work efficiently in variable market conditions. Non-optimized systems do not work efficiently in new market conditions.
2-) Strategy should definitely be used on 15-minute charts. Otherwise, it will lead to losses!!!
Turkish Information:
Bu strateji ortalamaya geri dönüş metodu üzerine kurulmuş sistemleri içerir.
Sistem içerisindeki volatilite, trend, momentum, hacim, uyumsuzluk ve yapay zeka formasyonlarından onay alarak AL-SAT sinyallerini oluşturur.
Pump ve Dump(aşırı ani yükselişler ve düşüşler) durumlarından etkilenmez. Bazı durumlarda bunu fırsata çevirebilir.
İşlemlerdeki zarar oranlarımız algoritmalar tarafından minimize edilir. Yani, içerisinde bulunan zarar durdurma sistemleri ve yapay zeka ile pozisyondaki zarar oranlarını minimuma indirmiştir.
ÖNEMLİ NOT:
1-) İndikatörümüzün verimli bir şekilde kullanılabilmesi için her ay düzenli bir şekilde parametrelerinin optimizasyonunun yapılması gerekiyor. Değişken piyasa koşularında verimli çalışabilmesi için her ay düzenli olarak teknik ekibimiz tarafından optimizasyonu yapılarak sizlere sunulmaktadır. Optimize olmayan sistemler yeni piyasa koşullarında verimli çalışmazlar.
2-) Strateji kesinlikle 15 dakikalık grafiklerde kullanılmalıdır. Aksi taktirde kayıplara yol açacaktır!!!

Kifier's MFI/STOCH Hidden Divergence/Trend BeaterMFI/STOCH Hidden Divergence/Trend Beater
General Idea:
My premise around this strategy was to make a general strategy for crypto that would help out with finding entry positions for when you’re bullish on a crypto and want to hold on for a while, and at the same time avoiding massive drops. Essentially a way to mix long term/ swing trading; I somewhat achieved my goal however it still requires a lot of logic tuning of the trend averages.
I’m a huge proponent of volume indicators and coupled with average closing price, I think this gives a really good idea of what is happening with the market. It gives an idea on the market and retail investor sentiment. This generally gives you logical entry positions (Although I don’t know how amazing that will work with all cryptos, there’s a fine line between a good strategy and one that just rides bubble market conditions, some would argue that’s still a success and others not)
How it works:
There are many components to the strategy that try to do different things:
First of all there are two types of entries, a MFI hidden divergence with a STOCH check, essentially it will only fire when a divergence is detected while STOCH is above 50%, however this might be changed in the future as due to the volatile nature of cryptos, the STOCH is not too effective. The second entry is a simple MFI/STOCH trend, if STOCH is above 50% and the trend is detected to be in a trending long, once a MFI crossover over the 50% line is detected an entry is placed, this is designed to get out profit where the divergence would otherwise be less accurate during strongly trending conditions.
-MFI is a great indicator, as a volume weighted momentum indicator I find it the most accurate of all, the STOCH however is a great indicator to get a general picture of simple market conditions and can filter out the emotional noise of retail investors.
-VWMA and an SMA (The bottom oscillator) gives an idea of the trend tacking into account of the volume, this serves as a more short term filter of the trend for filters.
-OBV checks are done between the OBV and an EMA of the OBV, to get the idea of a volume weighted long trend, which is important for crypto as there are massive rallies to go up due to retail greed, it’s great to jump onto it at the beginning, and get off before the stack of cards fall apart.
-ATR is used to detect when the market is relatively just ranging or moving sideways, which is where the hidden divergence entries are done, during predictable and profitable market conditions.
- Stop loss is based on the closest support of the entry, this is a nice medium of room to breath but also an actual stop loss.
Future plans and improvements:
Currently there’s a lot I want to improve, mostly the divergence detection and the overall sharpe ratio could be much better, but the current value of 0.5 gives me hope that the strategy is onto something. I also want to change TP from a percentage stop to something more dynamic but that might be too optimistic. The current plan is to paper trade test this either by manual or by a python bot, to see how it performs with some user input as well.

Khair Day trade with profit lossBest used when applied for intraday trading. Users can customize length and deviation to fit their needs. Works best for high volatility stocks.
This strategy only works intraday intervals, so it means when you try to apply it to day/week/month it won't show any entry or exits.
Bollinger band breakout with non-standard deviation along with profit targets and stop loss.
There are 2 profit targets that can be adjusted based on individual preference.
This strategy minimizes risk and only opens trades when the probability of profitability is higher.

Godtrix's Crypto HA+RSI+EMA+ATH+DCA Strategy 3.0New Updates is here! Upgrade from previous version 2.0 (Please avoid using v2.0 as it's outdated.)
Great stability, Repaint bug fixes, and New features!
==================
| Introduction: |
==================
This is a Long Term Strategy, using compounding profit method, it can generate high returns, but it also risk for losses, this can be overcome if you set Stop Loss to over 25% for bitcoin & 60% for Altcoins.
Best profit plan with this strategy is you trade on Future leverage while you hold on to your coin, so that when price goes up, your coin value goes up, and at the same time, you trade with your leverage to earn even more, easily doubling up your total profit.
Benefits:
Fully customizable and you can easily personalized it and FINE TUNE it according to the market or coin you trading on.
The strategy is based on REAL PRACTICAL trading skills, so it works in real-world.
I fixed the "repainting" issue so the backtest it shows you IS ACCURATE when you run for real-time.
We all know one indicator is not going to help you win your trades, so this strategy combines ALL three: EMA for long+short term trend, HA for short term trend, RSI for entry/exit
This strategy is designed for LONG trade (Buy low, Sell high), not for SHORT trade.
This is not day trading, it is more to mid-term trading, where there's only few trades per month
Mainly is coded to work with 3Commas bot auto trading, so you only need to key in your Bot ID & Email Token.
Bot trading NOTE:
- You need to replace the Alert Message with this: {{strategy.order.alert_message}}
- And you'll need the Bot's webhook Url set with the Alert too.
- One Alert will work for both Buy and Sell Order
- If you using other Bot service, you can enter Custom Command in Input Settings too, it works on any bot service.
Lastly,
regarding the setting advice, I would say you try playing with different settings and your objective is to achieve a backtest result that has:
1) Profitable is > 80%
2) Losing trades is nearly 0 or below 25% of your winning trades. Trick is using far stop loss %
3) Net Profit be almost same or more than "Buy & Hold Profit"
==================
| Latest Updates: |
==================
=| Tidy Up Codings |=
- Group input fields so it'll be easier to understand and find the settings
- Upgrade code for obsolete 'transp' options
=| Repaint Issues |=
- Previous v2.0's RSI has repaint issue, creating false result against real-time data. I've fixed this.
- Also done fine-tuning other parts of the codes to prevent possible repaint issues.
=| Bot System |=
- Improved Custom Bot system, so that you're able to set dynamic order size/quantity with my custom keyword: and
Base Order Example:
{ 'message_type': 'bot', 'bot_id': 1234567, 'email_token': 'abcdefgh-1234-1234-1234', 'base_order': , 'delay_seconds': 0, 'pair': 'USDT_BTC'}
=| EMA Downtrend Exit |=
- Added option for you to decide whether to close position when detected EMA Long term downtrend.
=| EMA 2 (short term) is removed |=
- After several test, I've decided to remove this because it doesn't contribute to improving the results.
=| Heikin Ashi System |=
- Improved the chart display, now you'll see the HA candle 'shadowed' behind, so you'll see both actual price candle and HA candle at same time.
- Added the system that detect the HA candle sizes to decide specifically when it's suitable for Entry and Exit.
>> For "Entry/Exit Range"
- This means after HA is valid for Entry or Exit, how many following bars are allowed to stay valid so it will match other requirements to be completely fulfilled for Entry or Exit.
>> For "Crossing Interval"
- This means after detected HA line crossover, how many HA intervals is allow to Entry or Exit
>> For "Reversed Exit"
- This function let's you decide whether to close position if after HA bull (green candle) changed into HA Bear (red candle)
=| RSI A Entry |=
- Added option to avoid Entry during NTZ (No trade Zone)
- Also added the option to avoid next same condition RSI A entry too soon
=| RSI B Entry |=
- This function is for Entry if RSI is going very low, mostly due to bigger price drops in short time, it's good for buying DIP, however we'll never be able to know when a DIP ends, so do more test on this settings before put into real use.
- Added "avoid" options to help avoid getting Entry at "false" DIP, more like a short & fast pullback which causes RSI to drop very low but actually the price is near ATH or Recent High.
- Added option for Entry with Trailing Price Lower Buy combine with a limit order that grabs low price, so whichever it fulfill first.
=| New: Avoid Entry |=
- Well, it's a pain if you bought at the top, so I've added two options that will avoid buying near ATH and Recent High.
=| Time-limit Removed |=
- Sorry that I've missed look on the script policy which I'm not allowed to put a time-limit for public scripts.
=| System Improvements |=
- HA condition detection is optimized and bug fixed
- RSI values now reads accurately on each bar despite using higher timeframe, especially when moving to next interval
=| New: Dollar Cost Averaging (DCA) Orders |=
- Although DCA strategy is not appealing for Long term strategy, but I've added it for your extra options and flexibilities.
- The settings are quite straight-forward and standard, so I won't be explaining here.
=| New: Backtest Start & End Date |=
- This is very good function when you need more accurate result starting at specific date & time.
- Also if you set the date & time for your real trading starts, it'll much result the same as your actual trading records, which helps you to see clearer and make future decisions.
Any found bugs or flaws, please feel free to PM me, I can't get notifications from comments here below, so I'll not able to reply you the soonest possible, still not sure how to turn on notification for comments, anyone who knows can PM and teach me, lol... Thanks in advance!
Well, this is free version, hope it helps! Feedbacks are all welcome :)
(To Moderators: I've fully use the "f_security()" guideline, but instead of creating a separate function, I apply directly on all security() function. Please don't ban my script before fully check if I've truly fixed repaint. Thank you.)
BITSTAMP:BTCUSD COINBASE:BTCUSD COINBASE:ETHUSD BINANCE:BNBUSDT

Bollinger Band with RSI
Using combination bollinger band and RSI indicator as guide to predict price volatility and the best entry point. The strategy logic is pretty straightforward where we're interested with close price that touches the lower bollinger band ; there are only two scenarios that will happened after the price reaches the lower band; the price might rebound from the lower bollinger band or drop lower and continue downtrend. To confirm the price movement, we use a second indicator which is the RSI to further investigate the price trend. For example, if the price reaches the lower bollinger band but the RSI value is not in the oversold region, we can conclude that the price will go lower and continue downtrend. If the RSI value is in the oversold region, we can use this price area as our entry point.
Stop loss is necessary to avoid losing too much capital if the RSI value lingers too long in the oversold region.
Best take profit area is when the price rebound above the middle bollinger band area/upper bollinger band or when the RSI reaches overbought region; whichever comes first.
Long entry:
RSI < 30 & close price < lower bollinger band
Exit entry:
RSI > 70
Default stop loss: -25%

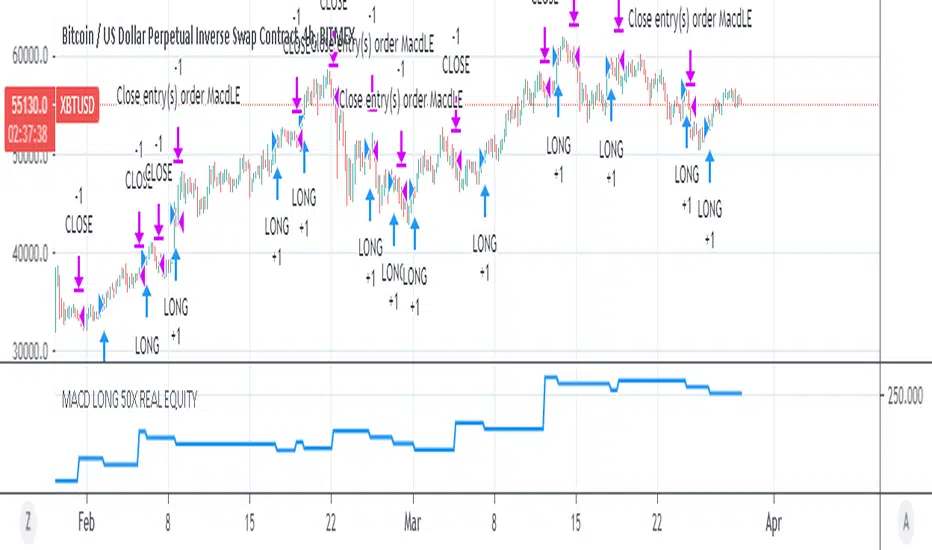
MACD 50x Leveraged Short Strategy with Real Equity
Hello there ,
Short version of the Macd Long strategy.
MACD Long strategy:
Adding margin: Forbidden or not specified. (Add Margin : No)
Position size: (for each trade) 1%
Stop-Loss: (2% Above Entry Level)
Long: macd crossunder
Exit: macd crossover
Or ofc touching the stop-Loss value as predicted.
These strategies are just examples.
The goal is to observe true equity and equity change.
Warning: This strategy simulation is for Short direction only.
Regards.

MACD 50x Leveraged Long Strategy Results with Real Equity Hello there.
I was looking for a way to simulate leveraged transactions in Tradingview and this script came out.
You can examine the equity graph without looking at the strategy results.
Thus, the facts will come to light.
Strategy parameters:
Adding margin: Forbidden or not specified. (Add Margin : No)
Position size: (for each trade) 1%
Stop-Loss: (2%)
Long: macd crossover
Exit: macd crossunder
Or ofc touching the stop-Loss value as predicted.
Warning: This strategy simulation is for Long direction only.
Regards.